Table of Contents
Why contact center reporting gets stuck
Reporting usually starts with your contact center platform’s own dashboards. They cover queue and agent statistics well, and they stop at the edge of that platform.
Quality scores sit in one tool. Forecasts and schedules sit in another. Sentiment and topics come from speech analytics, and revenue lives in the CRM.
Take a question like “which contact drivers added the most handle time this month?” Answering it means exporting from three systems and joining the data in a spreadsheet. That work usually falls to one analyst, and the answer arrives days after the interval it describes.
Where SuccessKPI fits
SuccessKPI keeps quality, workforce, conversation, and endpoint data in one schema. Several datasets join inside one dashboard, so a cross-system question doesn’t need an export.
Out-of-the-box reports run roughly one hour after data starts flowing. Subscriptions send reports to people on a schedule. Scheduled delivery writes CSV, JSON, or Excel files to your storage bucket. Scheduled imports bring external data, such as CRM records, back in.
Documented platform coverage includes Genesys, Amazon Connect, Five9, Zoom, Talkdesk, LiveVox, Cisco Webex, Alvaria, and TCN. Customer data stays in your contracted deployment region and is encrypted at rest and in transit. Role-based access reaches down to the data partition.
The reports below come from our reports library and from dashboards customers have built. Some ship out of the box, and others are starting points you adapt. What you can run depends on the SuccessKPI products and contact center platform you use.
Chapter 1: Contact center overview
Start here when you need the state of the operation in one view. These reports cover volume, speed, and quality, and how each compares with plan.
Top KPIs
Top KPIs and the trends behind them
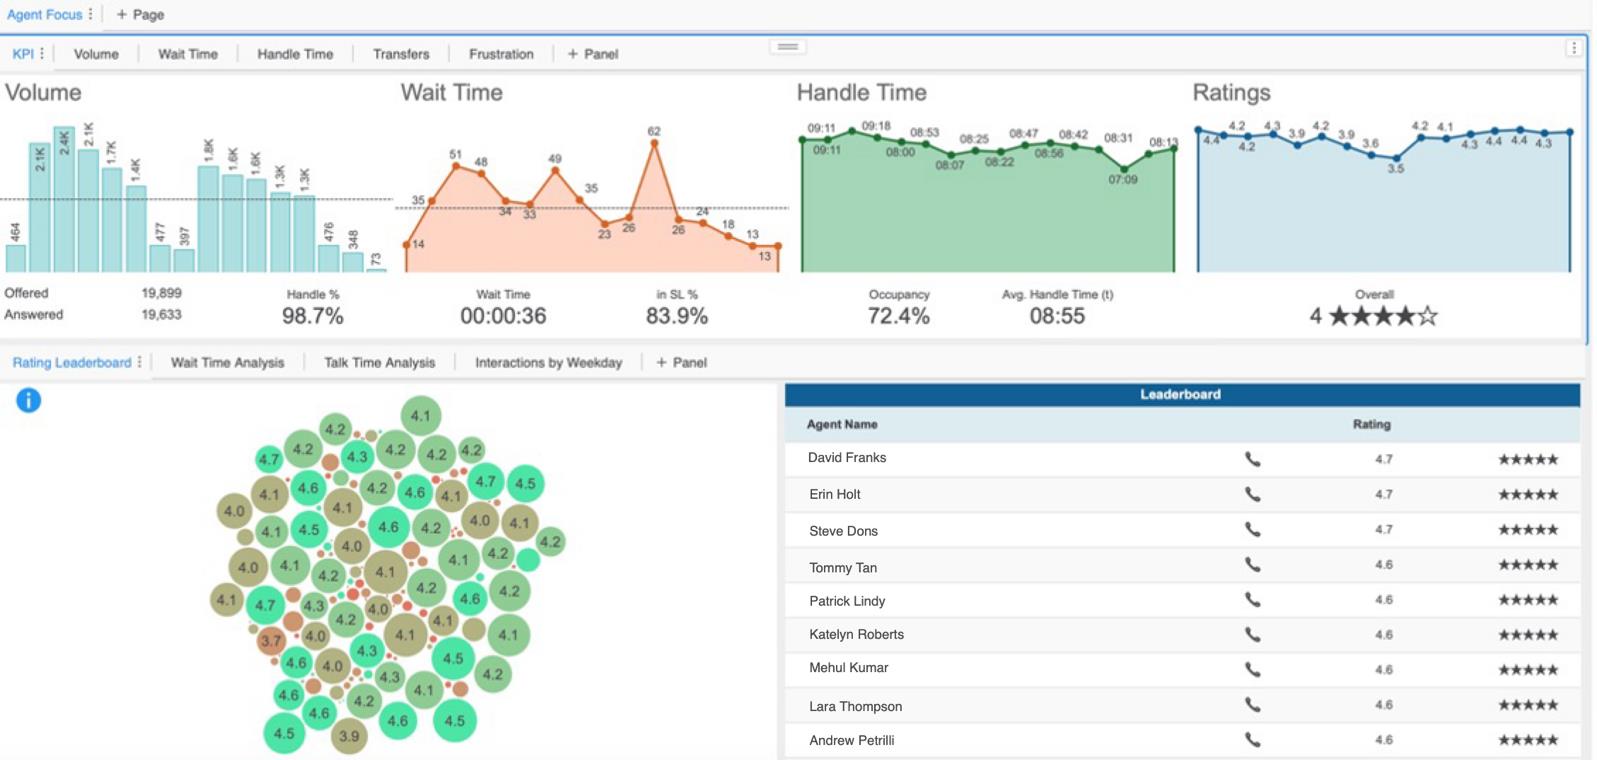
Track calls, wait time, handle time, and NPS survey score by date, 30-minute interval, and agent. When a number moves, you can see which interval and which agent moved it.
Attributes
- Date
- 30-minute interval
- Agent name
Metrics
- Calls
- Average wait time
- Average handle time
- Average NPS survey score
Filter by
- Date
- 30-minute interval
- Agent name
Contact center performance
Core metrics across queues and dates
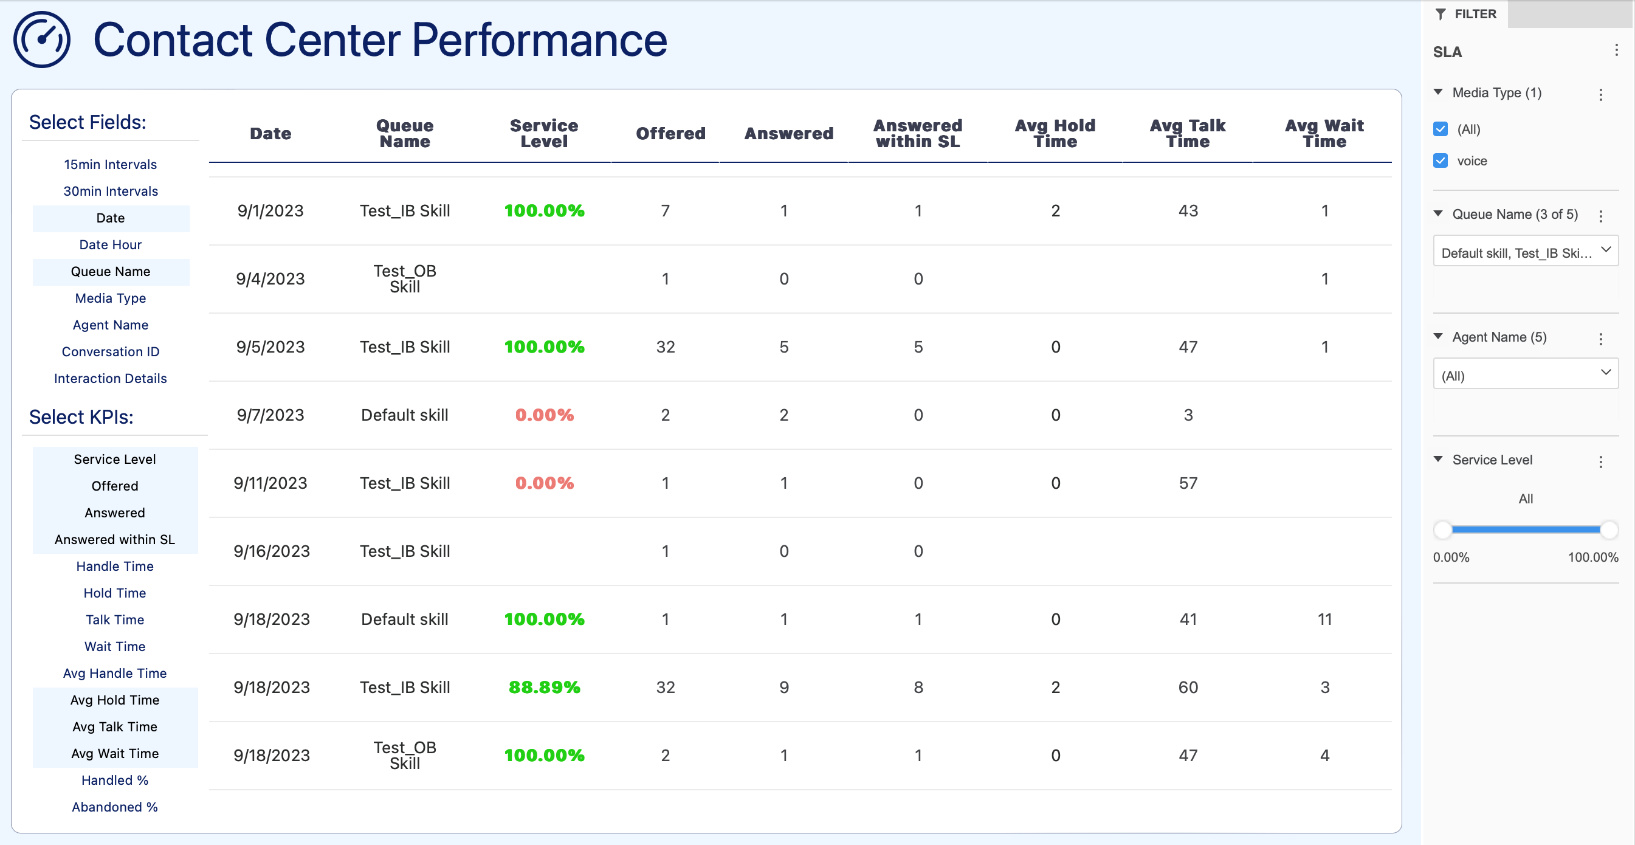
See service level, abandonment, and handle time by queue and date in one grid. Set thresholds so values outside your target change color, and supervisors spot a missed service level without reading every row.
Attributes
- Date
- Agent name
- Media
Metrics
- Offered calls
- Calls answered
- Calls answered within service level
- Abandoned %
- Handled %
- Average handle time
- Average talk time
- Average wait time
Filter by
- Agent name
- Queue
- Media type
- Service level
Performance to plan
Actual KPIs compared with forecast
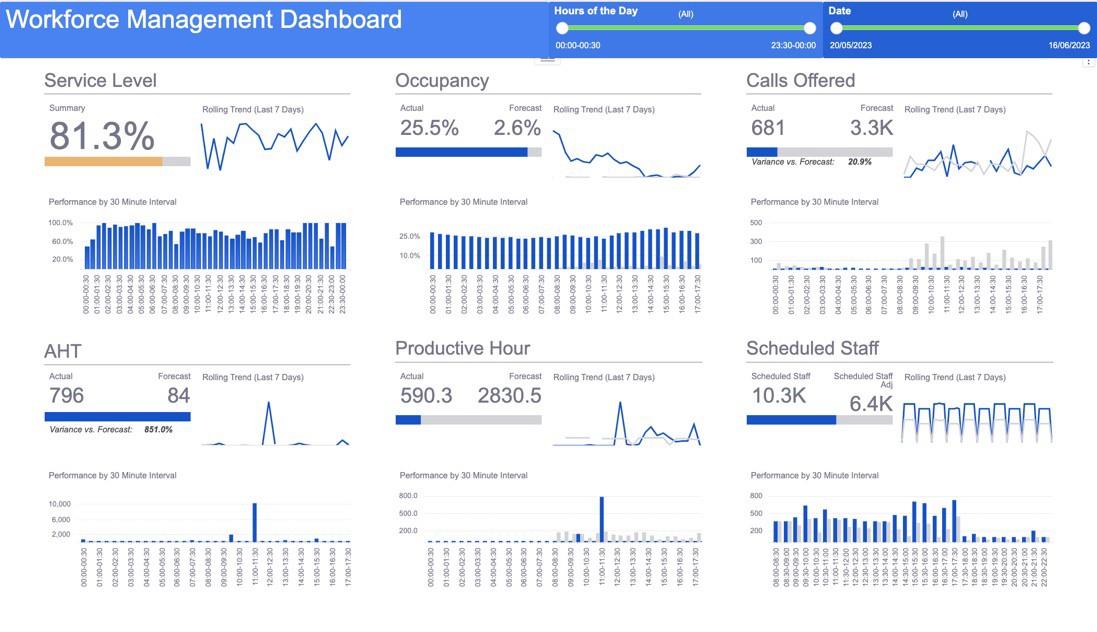
Compare actual service level, calls offered, handle time, occupancy, and staff with your forecast. Seeing scheduled and actual staff beside service level shows whether a miss came from volume, handle time, or staff levels.
Attributes
- Date
- Queues
Metrics
- Service level
- Calls offered
- Calls forecast
- Actual and forecast AHT
- Actual and forecast occupancy
- Scheduled staff
- Actual staff
Filter by
- Queues
- Date
Call journey
How calls move through the contact center
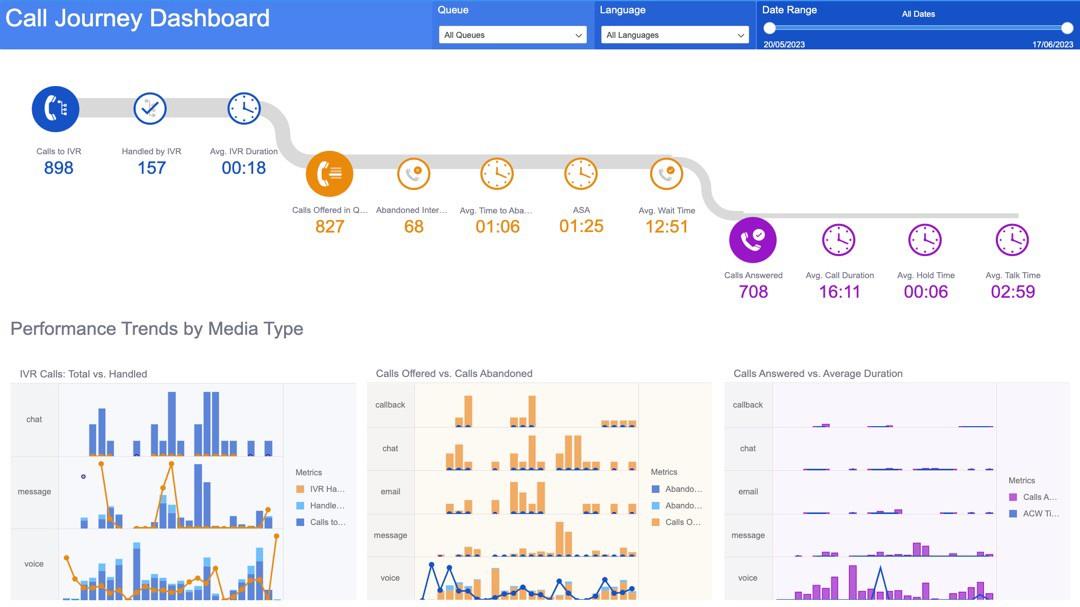
Follow calls from the IVR into queues and on to agents. See how many were contained or transferred, with IVR time, talk time, and hold time at each step.
Attributes
- Date
Metrics
- Total calls
- Calls contained
- Average IVR time
- Calls transferred
- Abandoned %
- Service level
- Average handle time
- Average talk time
- Average hold time
Filter by
- Date
Customer flow
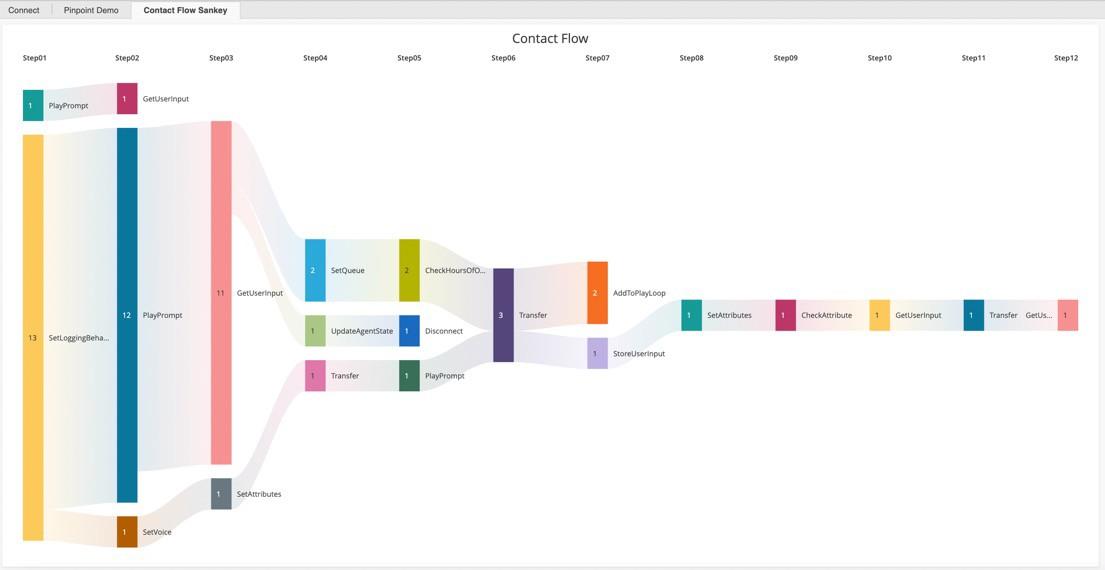
Each caller’s path through your IVR flow
A Sankey diagram traces callers through your IVR flow, block by block. It shows where callers drop off and the disconnect reason at each point.
Attributes
- Date
- Flow name
- Flow variables
- Block name
- Disconnect reason
Metrics
- Number of calls
Filter by
- Date
- Flow name
- Flow variables
CRM integration
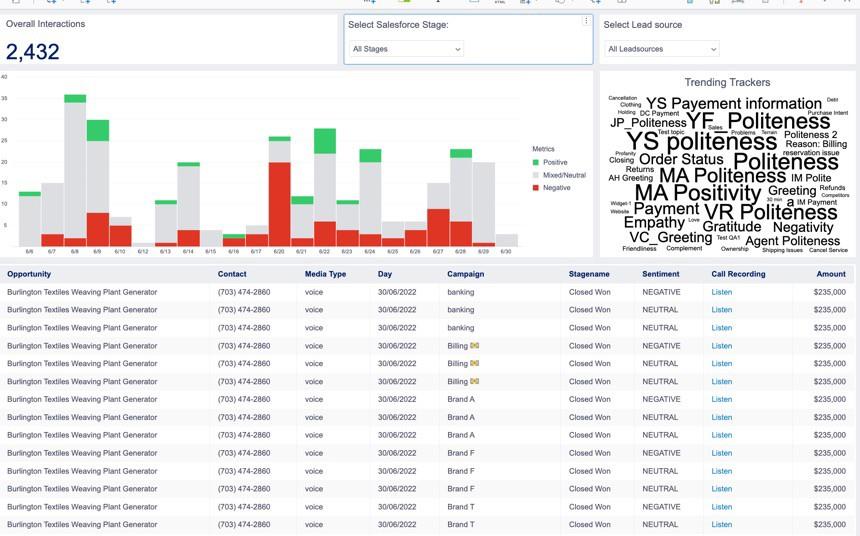
Salesforce data joined with contact center data
Join Salesforce opportunity data with handle time, sentiment, and topics from the conversation. Sales leaders can see which lead sources, campaigns, and conversation patterns appear in closed deals.
Attributes
- Date
- Lead source
- Campaign
- Sales stage
- Sentiment
- Topics
Metrics
- Opportunity amount
- Number of conversations
Filter by
- Date
- Lead source
- Campaign
- Sales stage
- Sentiment
- Topics
Geography report
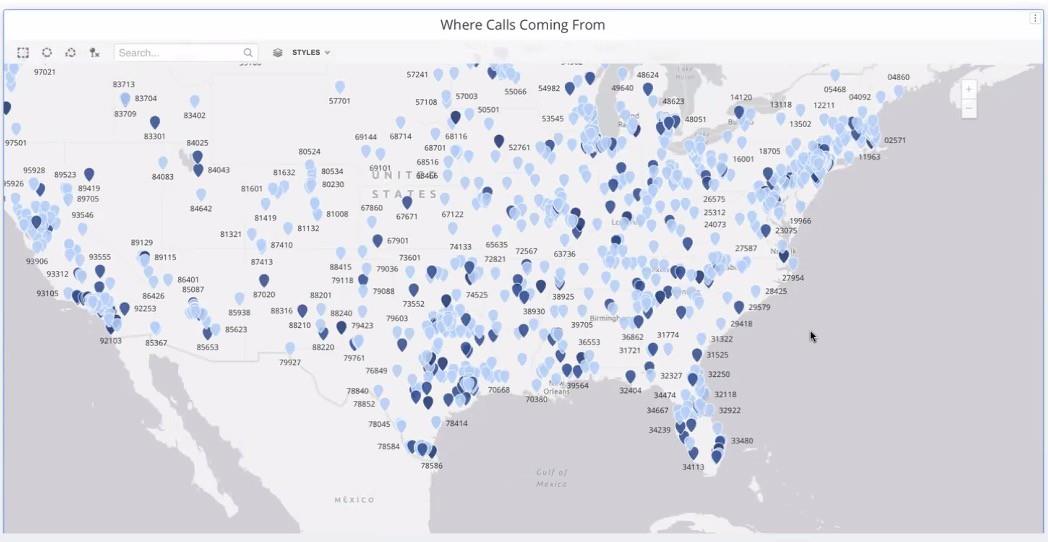
Where calls come from
Map caller phone numbers to city, state, and country. Compare where calls come from with regional campaigns and other location-based activity.
Attributes
- Date
- Caller ID
- Area code and exchange (NPA-NXX)
- City
- State
- Country
Metrics
- Number of calls
Filter by
- Date
- Flow name
- Flow variables
Multi-channel statistics
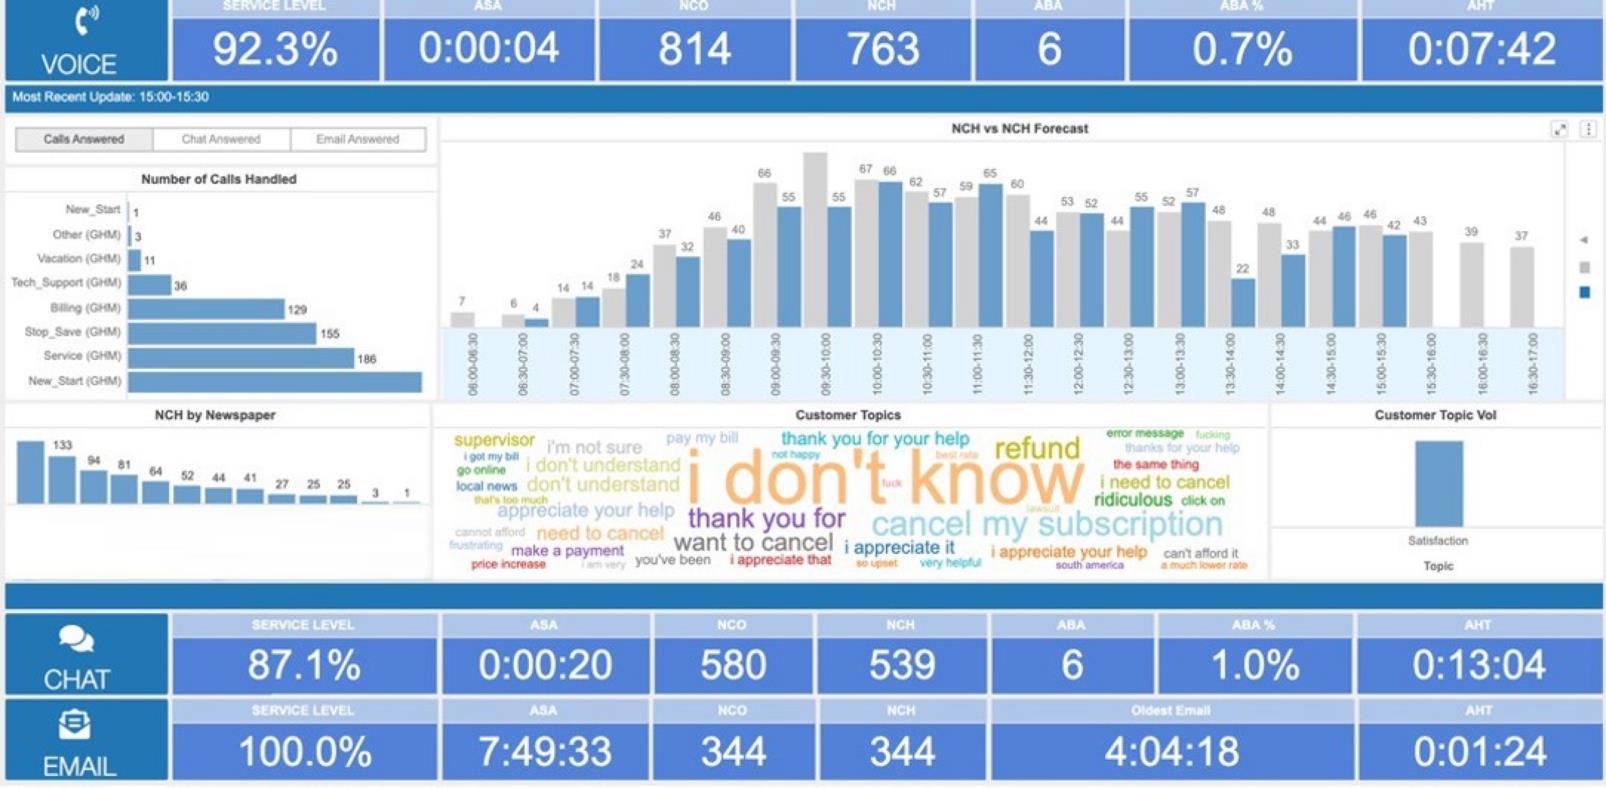
Handling statistics by media type
Review service level, handle time, hold time, talk time, and wrap-up time for voice, chat, and email side by side. Compare handled volume with what your WFM system forecasts for each channel.
Attributes
- Date
- Media type
Metrics
- Number of calls
- Service level
- Handle time
- Hold time
- Talk time
- Wrap-up time
- Forecast calls
Filter by
- Date
- Media type
Chapter 2: Queues and metrics
Queue reports show where demand is landing and whether each queue is keeping up with it.
Queue statistics
Key metrics for each queue
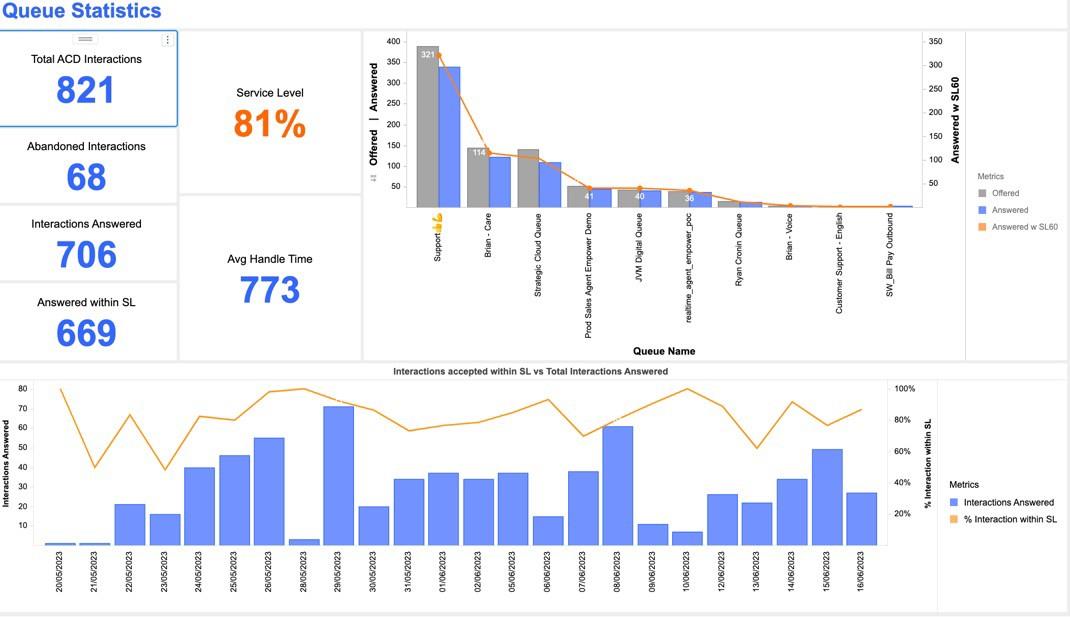
See total calls, calls answered, abandoned calls, calls answered within service level, and handle time for every queue. Sort by any metric to find the queue that needs attention first.
Attributes
- Date
- Queue name
Metrics
- Total calls
- Calls answered
- Abandoned calls
- Calls answered within service level
- Average handle time
Filter by
- Date
- Queue name
AHT analysis
A closer look at average handle time
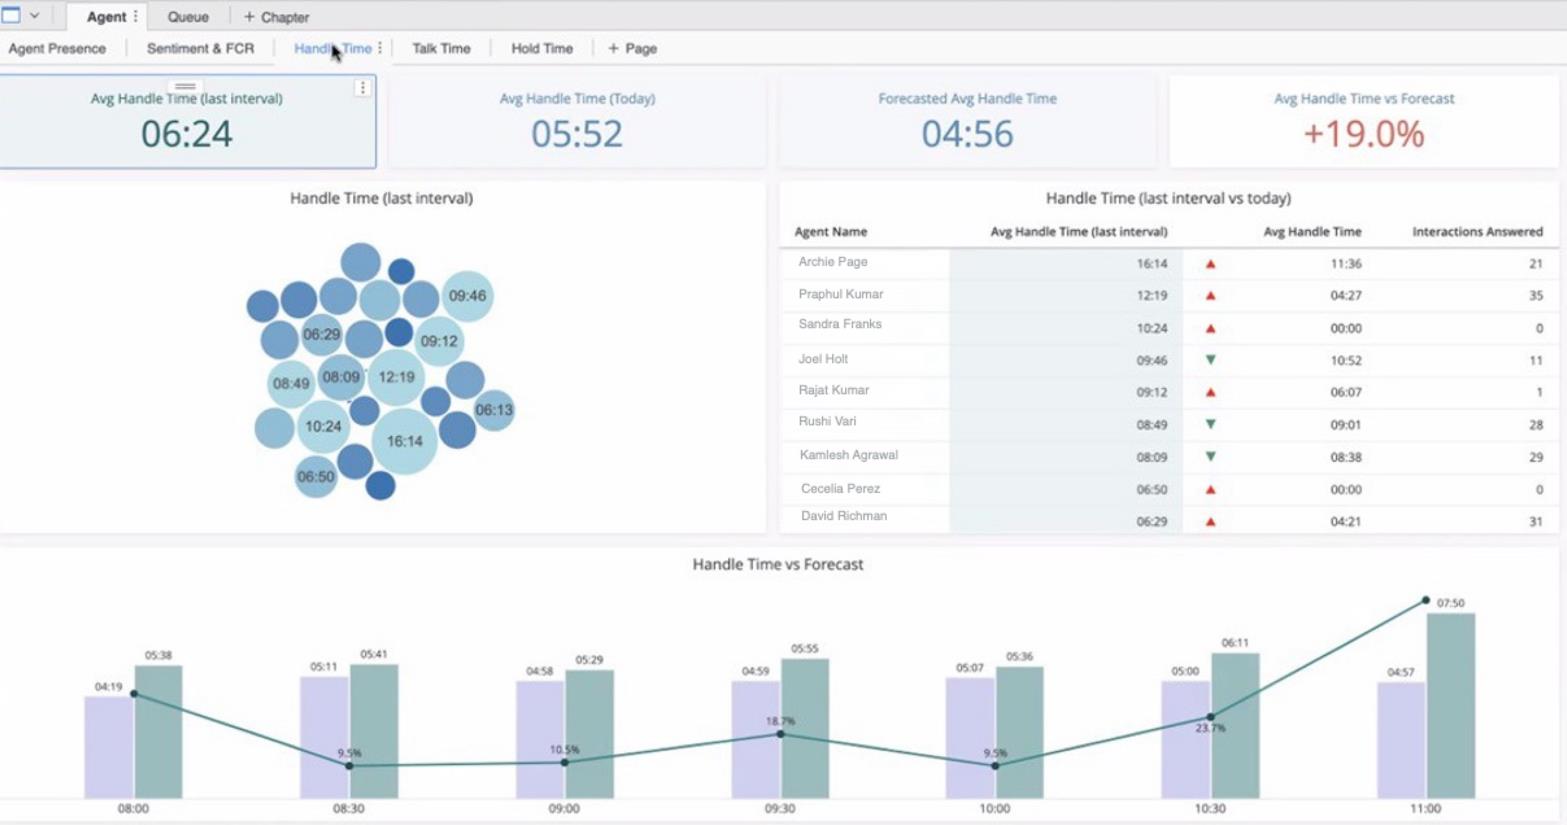
Break average handle time (AHT) down by date, 30-minute interval, queue, and agent, then compare each with forecast AHT. Use it to find which of those dimensions drove a variance from forecast.
Attributes
- Date
- Queue name
- Agent name
- 30-minute interval
Metrics
- Actual AHT
- Forecast AHT
Filter by
- Date
- Queue name
- Agent name
Real-time view
Queues and agents as they change
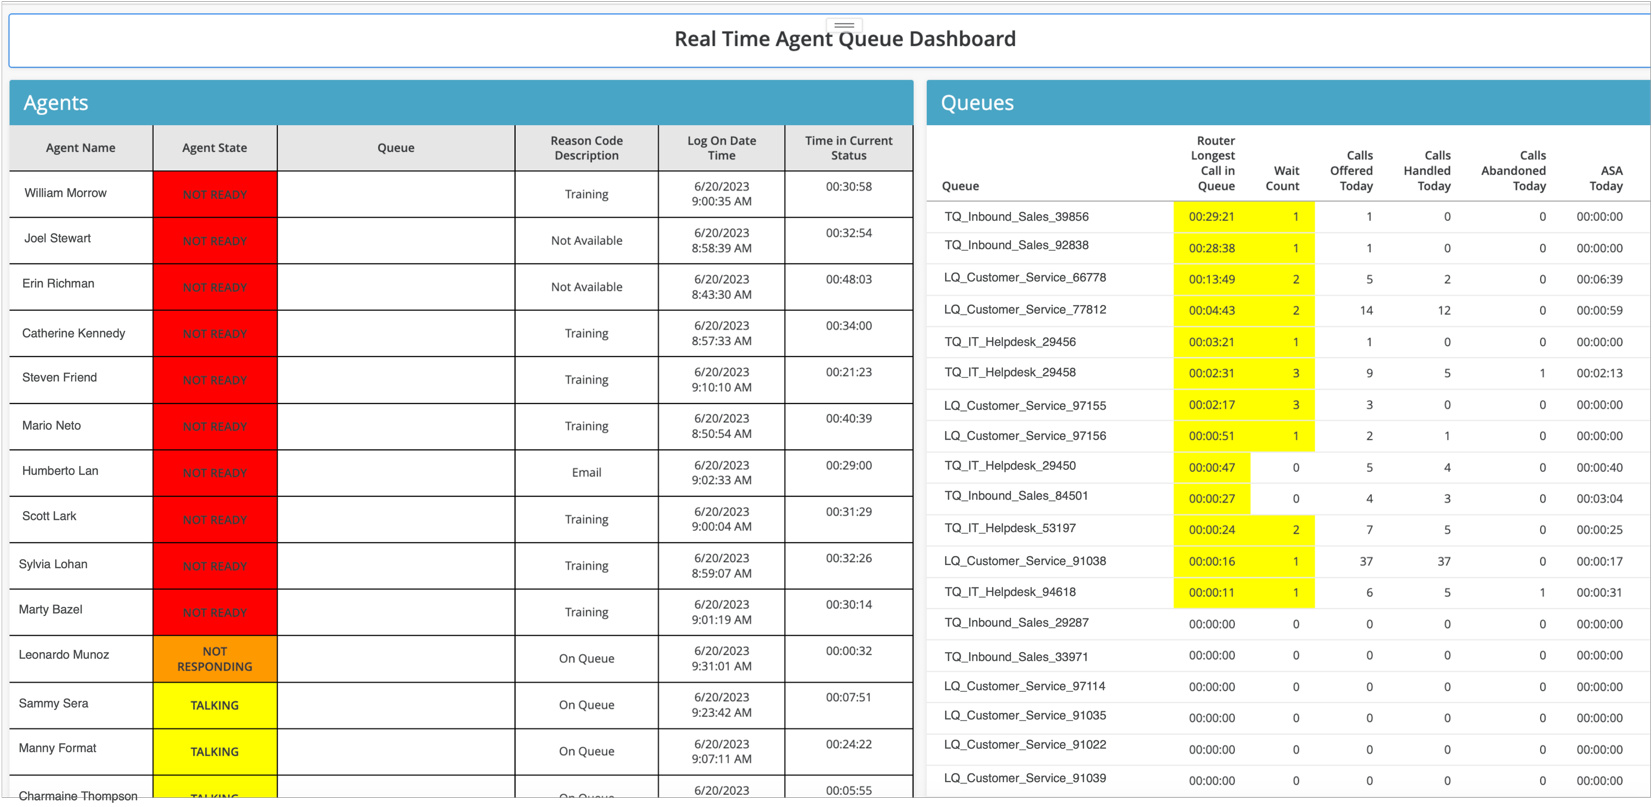
Monitor every queue and its metrics as they change, then drill into agents and individual conversations.
Attributes
- Queue name
- Agent name
- Agent status
Metrics
- Calls waiting
- Calls offered today
- Calls handled today
- Longest wait
Filter by
- Queue name
- Agent name
Chapter 3: IVR, IVA, bots, and automation
A containment rate on its own won’t tell you whether automation is working. These reports show which intents and flows succeed and which send customers to an agent.
Human and AI scoring
Machine evaluations compared with human evaluations
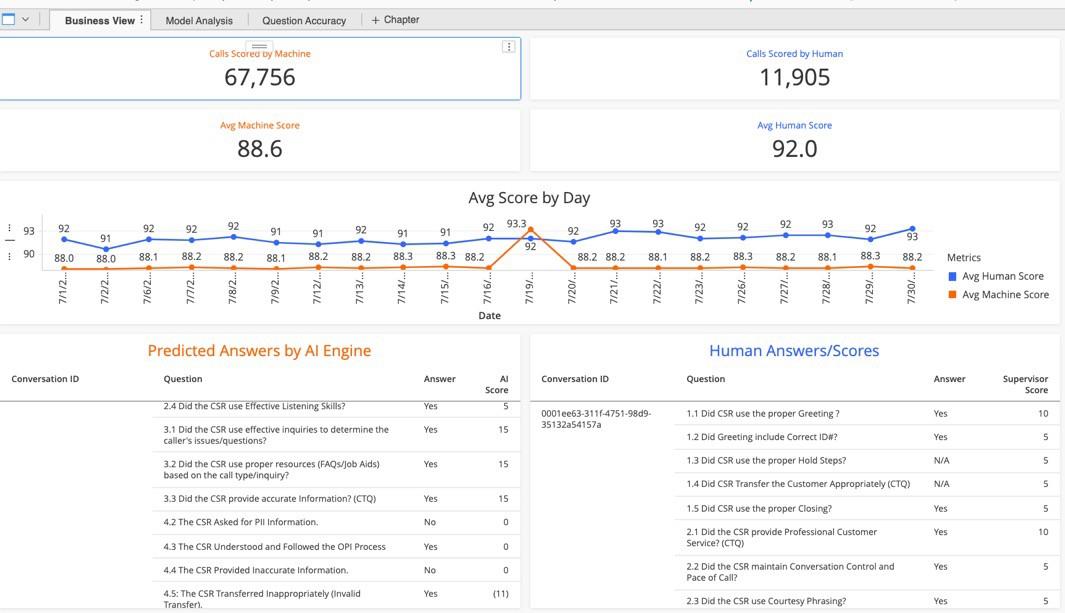
Compare AI evaluation scores with human scores on the same form, day by day. Machine learning scoring trains on your human evaluations and covers voice interactions. Where the two scores drift apart, calibrate before you rely on either one.
Attributes
- Date
- Evaluation form
- Contact ID
Metrics
- Human evaluations
- Machine evaluations
- Machine scores
- Human scores
Filter by
- Evaluation score
- Date
Bot intent report
Sessions by bot intent
Pull chatbot and conversational AI data to measure containment for each intent. Missed utterances show what customers said that the bot didn’t understand, so you know which intents to retrain first.
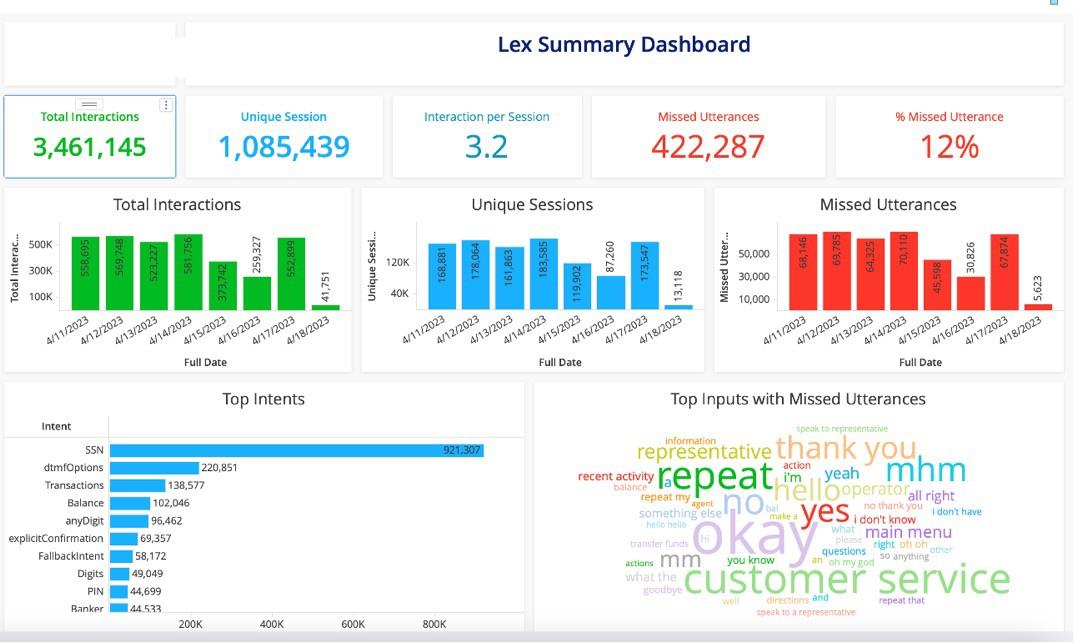
Attributes
- Date
- Flow name
- Bot name
- Intent name
- Utterance
- Call duration
- IVR duration
Metrics
- Containment rate
- Total interactions
- Contained interactions
- Transferred to queue
- Missed utterances
Filter by
- Date
- Flow name
- Bot name
- Intent name
Containment report
IVR containment with a daily trend
Measure your overall automation rate from IVR and Lex data, with a daily trend. Split it by flow, bot, and dialed number to see where containment is rising or falling.
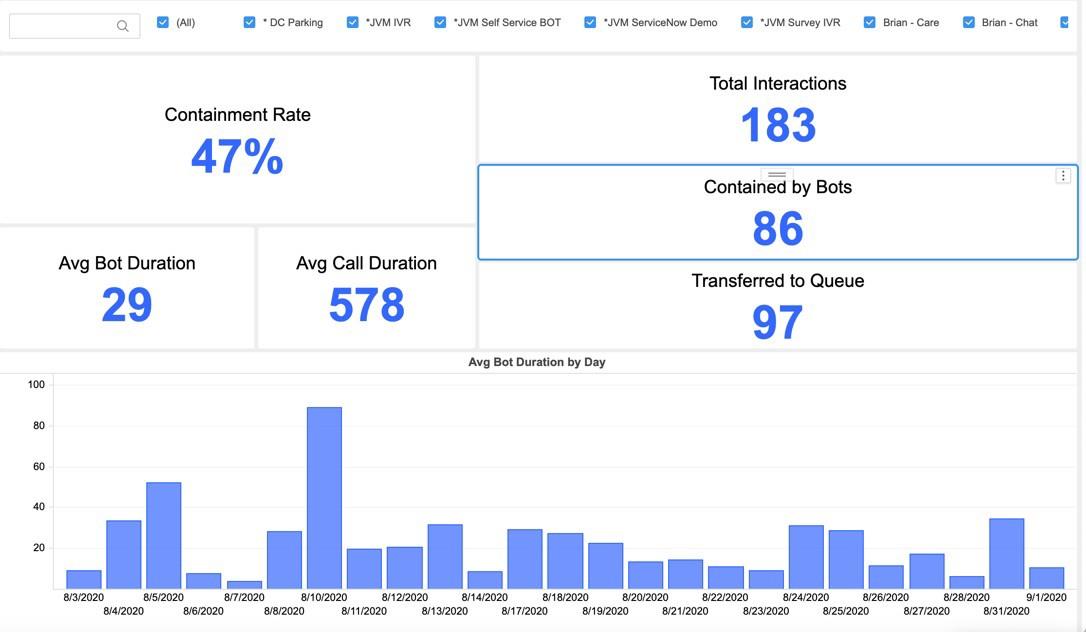
Attributes
- Date
- Flow name
- Bot name
- Dialed number
- Call duration
- IVR duration
Metrics
- Containment rate
- Total interactions
- Contained interactions
- Transferred to queue
Filter by
- Date
- Flow name
- Bot name
Chapter 4: Speech, quality, and sentiment
Disposition codes record what an agent had time to click. These reports read what customers actually said.
Speech and sentiment
Sentiment by channel, queue, and timeframe
See customer sentiment by channel, queue, agent, and timeframe. Conversation moments such as overtalk, silence, and conversation speed sit alongside it. Sentiment is scored from the transcript text, utterance by utterance. Moments are measured on the agent side of the call. Sentiment by call quarter is in beta.
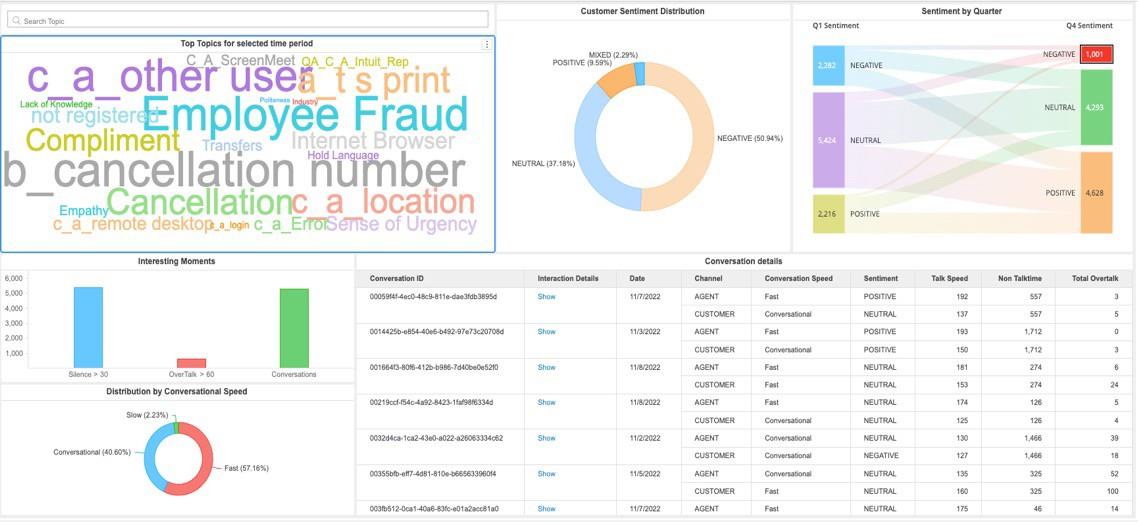
Attributes
- Date
- Queue name
- Agent name
- Call quarter segment (beta)
- Sentiment
Metrics
- Number of calls
- Conversation speed
- Overtalk
- Silence
Filter by
- Date
- Sentiment
- Queues
- Agent name
Sentiment distribution
Calls by sentiment and agent
Plot how sentiment is distributed across calls and how it shifts by 30-minute interval and agent. Use it to see which agents’ calls trend negative, and in which intervals.
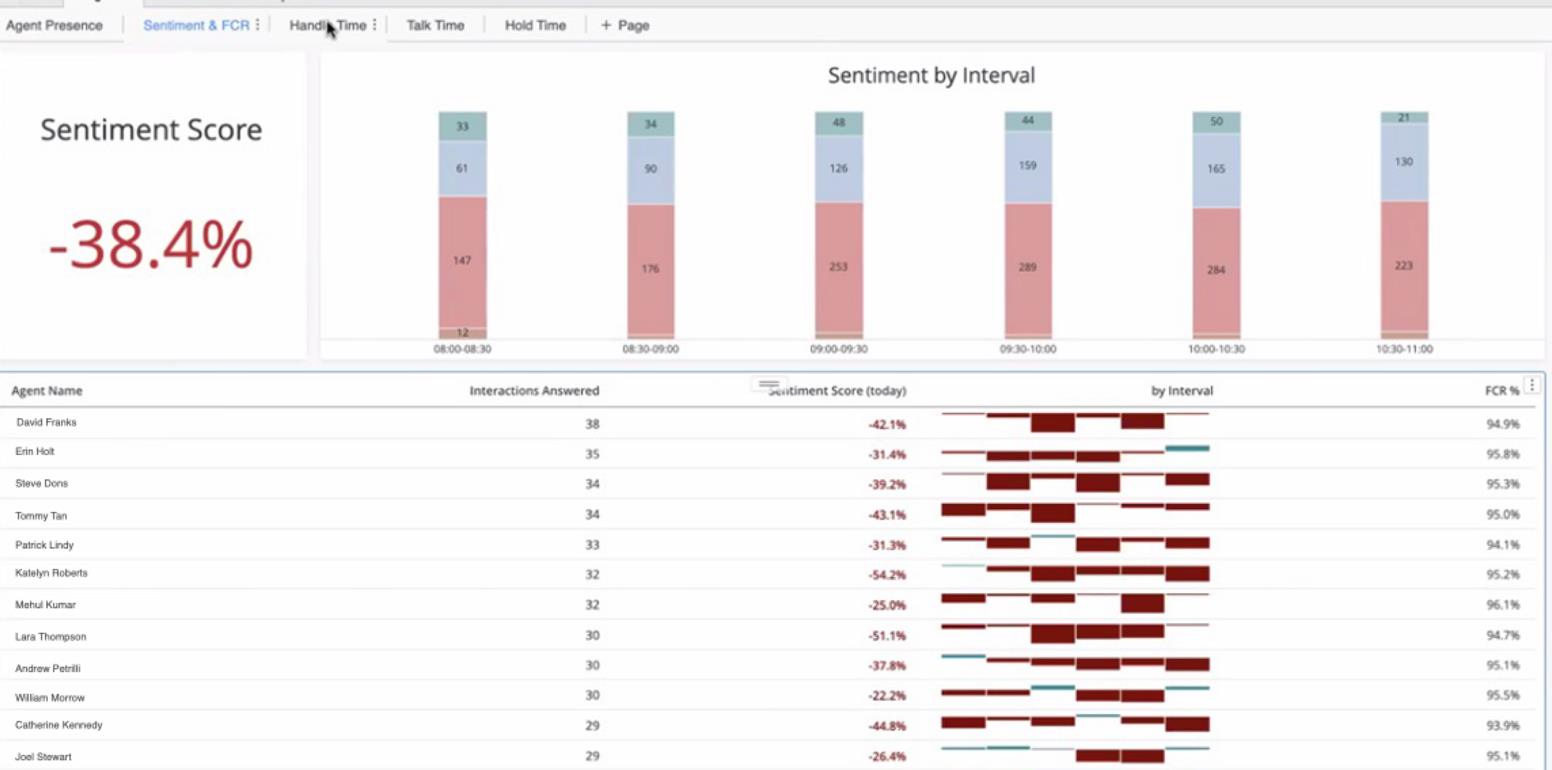
Attributes
- Date
- Agent name
- 30-minute interval
- Sentiment
Metrics
- Number of calls
- Sentiment score
Filter by
- Date
- 30-minute interval
- Sentiment
- Agent name
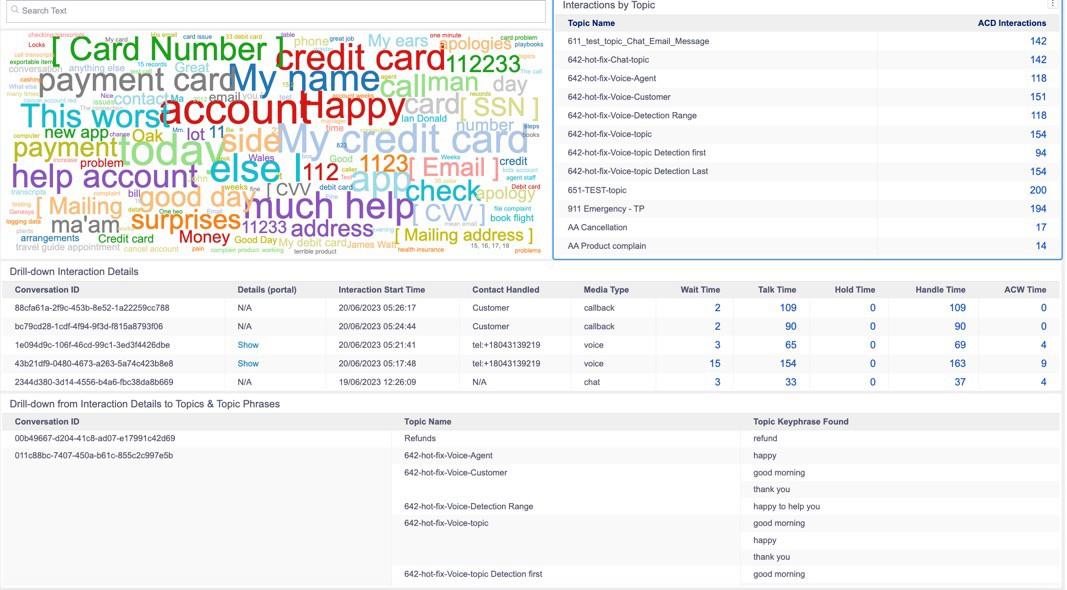
Trending topics
Top topics, with drill-down to calls
Find the top trending topics and the key phrases driving each one, then drill down to the individual calls. Topic detection covers 50+ languages.
Attributes
- Date
- Topic name
- Key phrases
- Sentiment
Metrics
- Number of conversations
- Talk time
- Handle time
- Hold time
Filter by
- Date
- Topic name
- Key phrases
- Sentiment
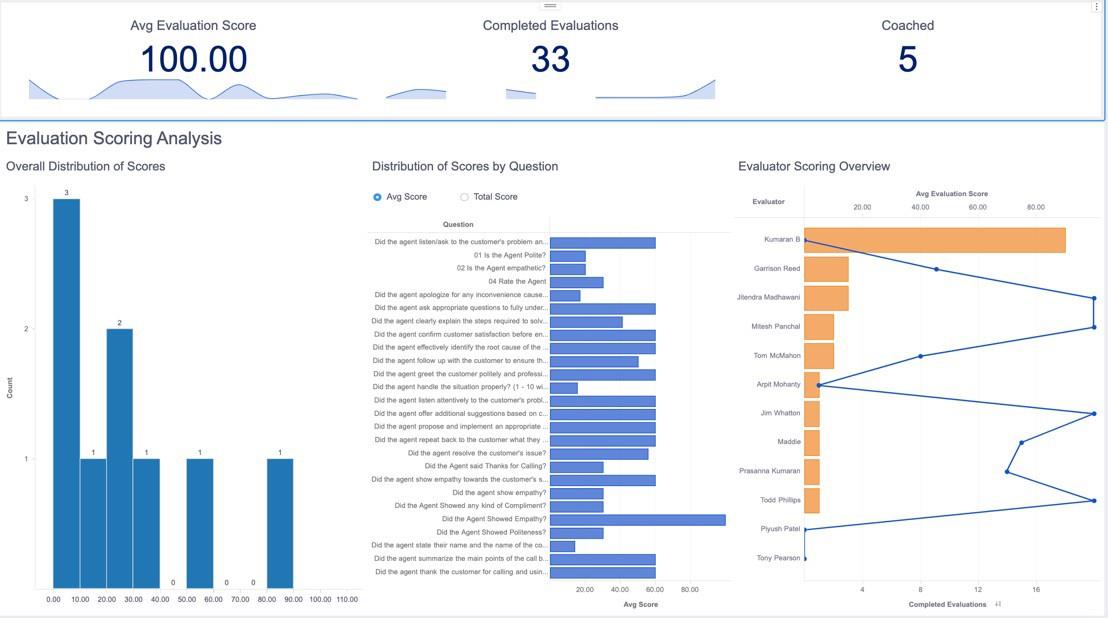
QM dashboard
Evaluation score analysis
Track average evaluation score, completed evaluations, and coached evaluations. Score distribution by question and by evaluator shows where a form or an evaluator needs calibration.
Attributes
- Date
- Evaluation form
- Evaluator name
Metrics
- Average evaluation score
- Completed evaluations
- Coached evaluations
Filter by
- Date
- Evaluation form
- Evaluator name
Chapter 5: Agent performance and insights
These reports connect handling statistics with quality and coaching, so a conversation with an agent starts from the full picture.
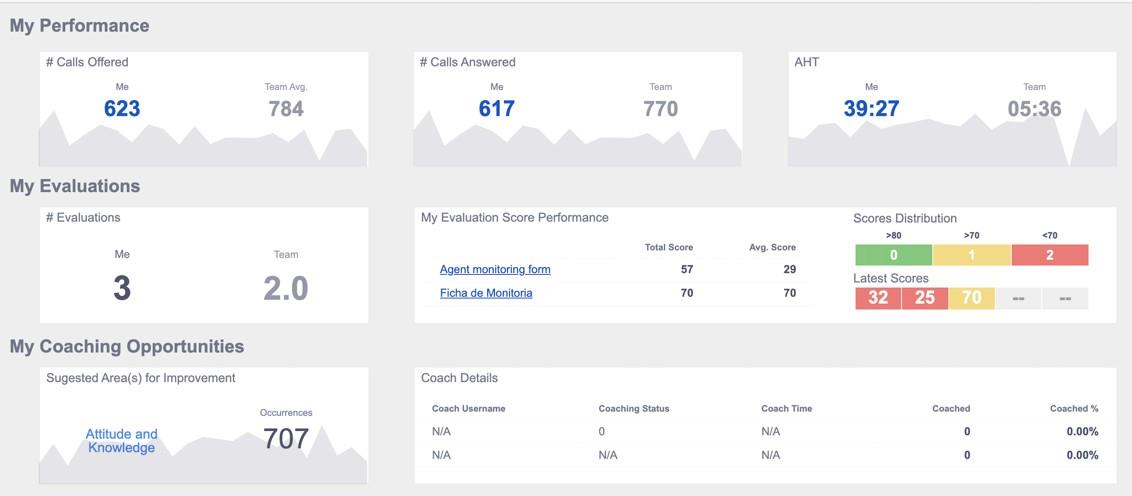
Agent performance
Individual agent performance
Give each agent one view that blends handling statistics with evaluation scores and coaching sessions. Agents and supervisors work from the same numbers.
Attributes
- Date
- Agent name
Metrics
- Calls offered
- Calls answered
- Average handle time
- Calls evaluated
- Average evaluation score
- Coaching sessions
- Coaching opportunities
Filter by
- Date
- Agent name
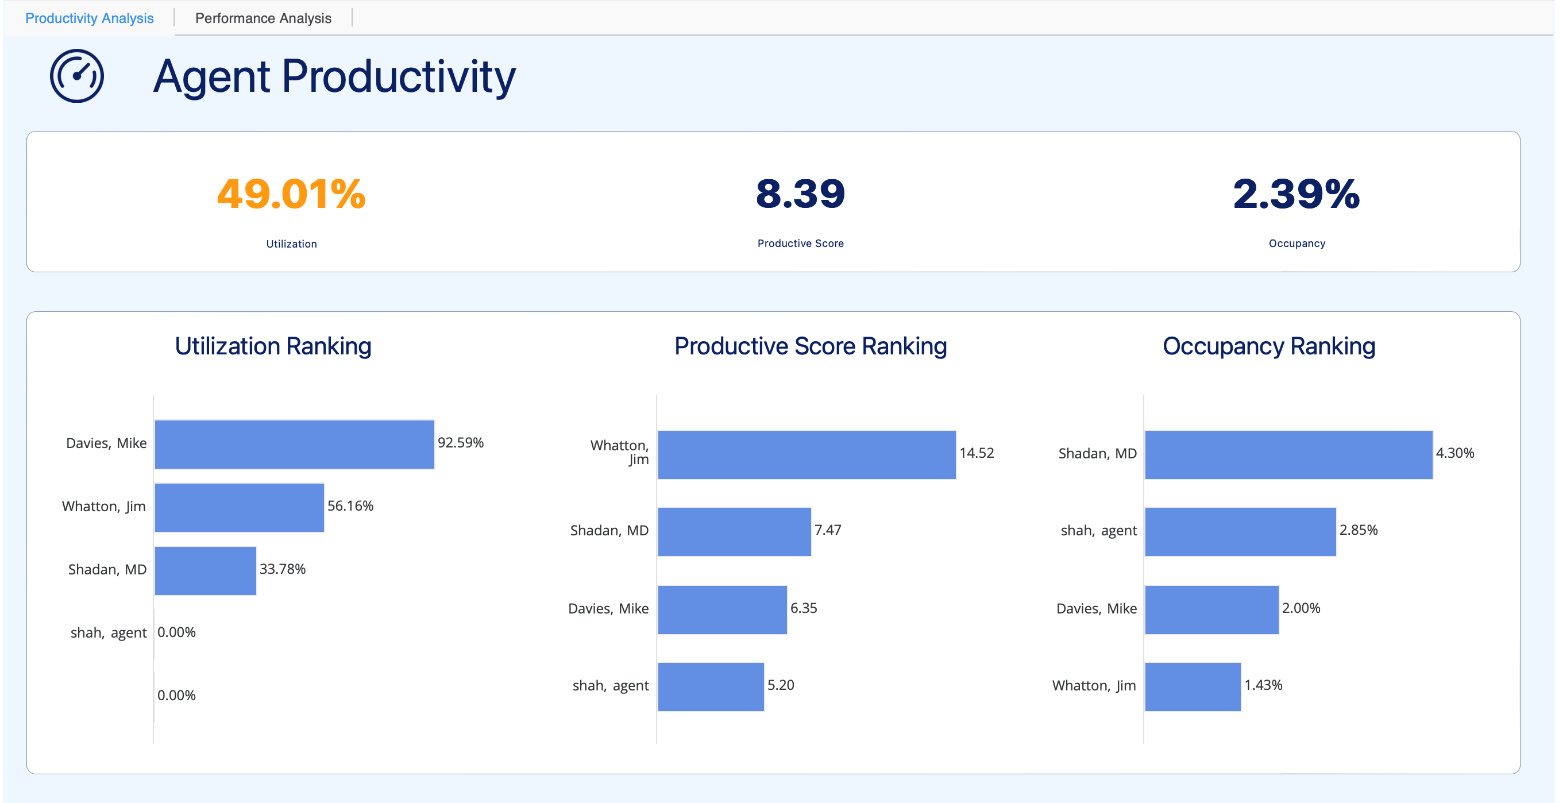
Agent performance scores
Agent metrics and ranking
Rank agents on calls handled, handle time, adherence, occupancy, productivity, and utilization. Find top performers to learn from and agents who need support.
Attributes
- Date
- Agent name
Metrics
- Calls
- Average handle time
- Occupancy
- Productivity
- Utilization
Filter by
- Date
- Agent name
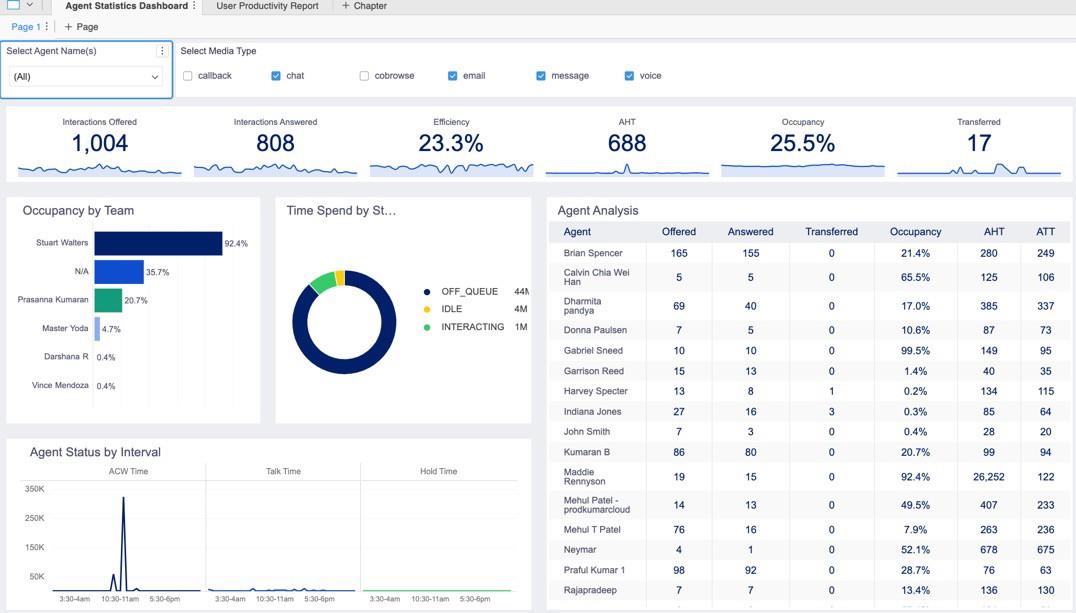
Agent statistics
Key metrics for each agent
See total calls, calls answered, handle time, average wrap-up time, and occupancy for each agent and team.
Attributes
- Date
- Agent name
- Team
Metrics
- Total calls
- Calls answered
- Average handle time
- Average wrap-up time
- Occupancy
Filter by
- Date
- Agent name
- Team
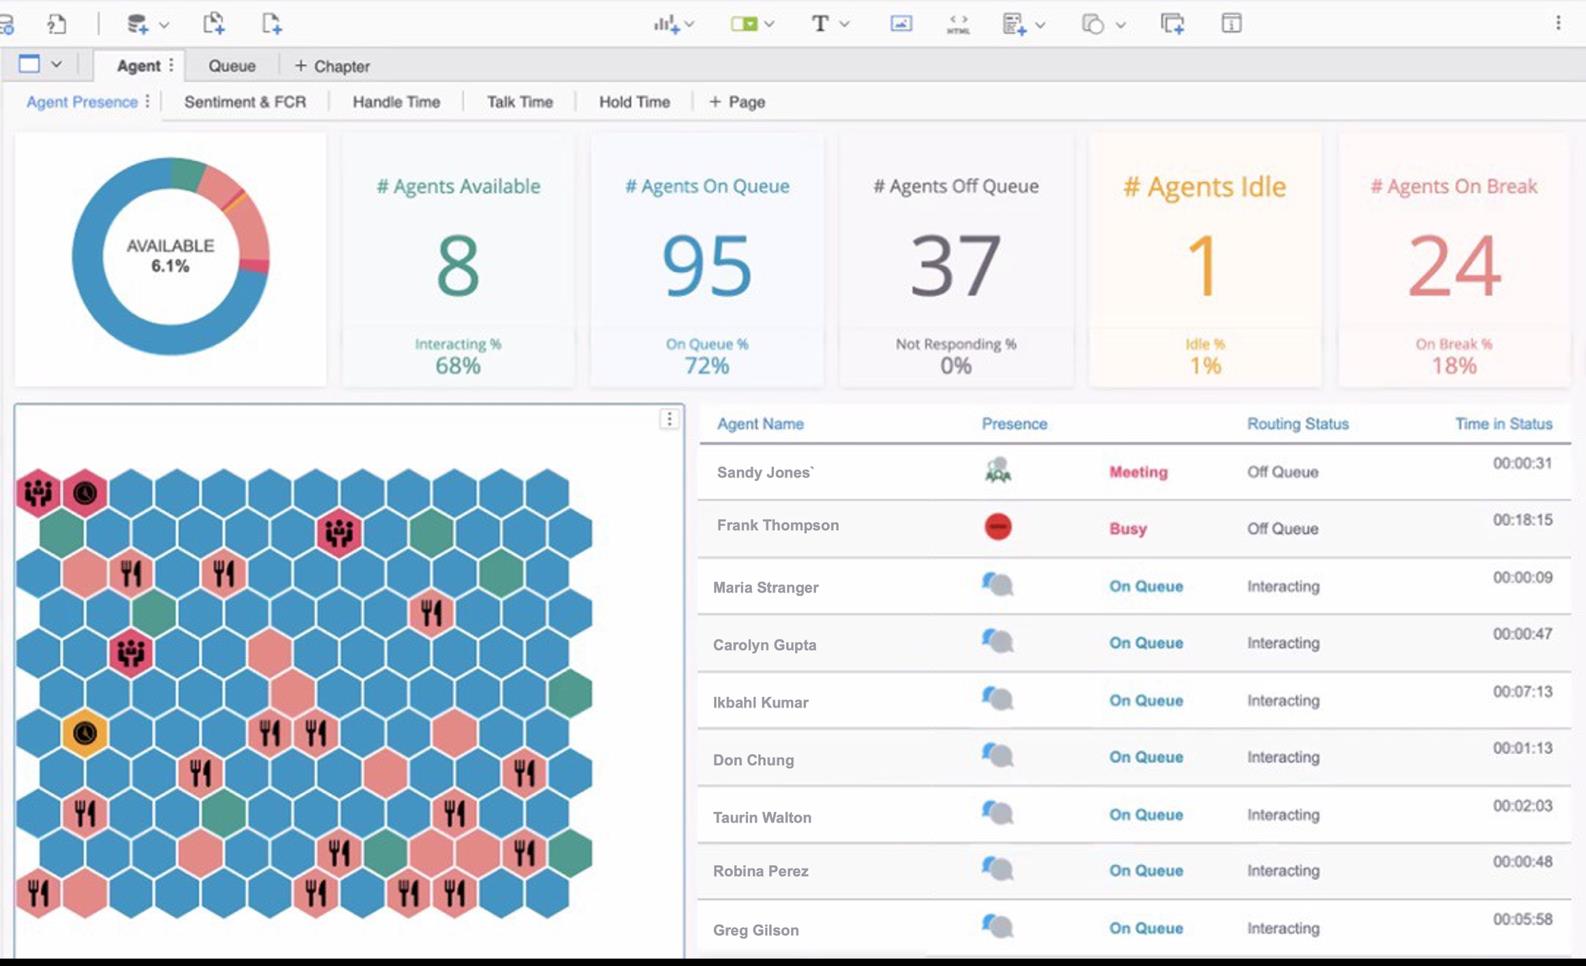
Real-time agent activity
Agent status at a glance
Each agent appears as a color-coded tile that shows status and time in status. Rules change a tile’s color and icon to draw attention to agents who need it.
Attributes
- Agent name
- Agent status
Metrics
- Number of agents by status
- Time in status
Filter by
- Agent name
- Agent status
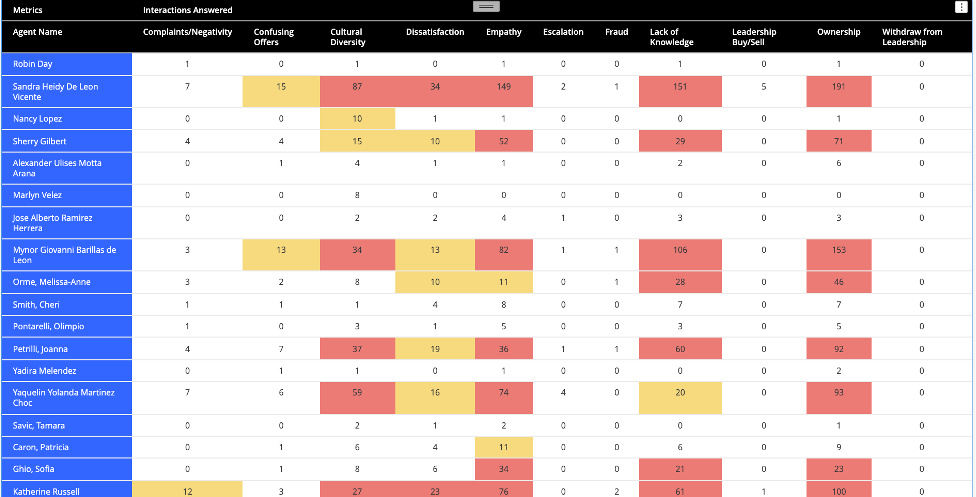
Agent coaching opportunities
Coaching needs found in conversations
Speech analytics detects topics tied to knowledge gaps, compliance misses, and other coaching areas, then counts them by agent. Coaching starts from what happened on the calls.
Attributes
- Agent name
- Topic name
Metrics
- Interactions answered
Filter by
- Agent name
- Team
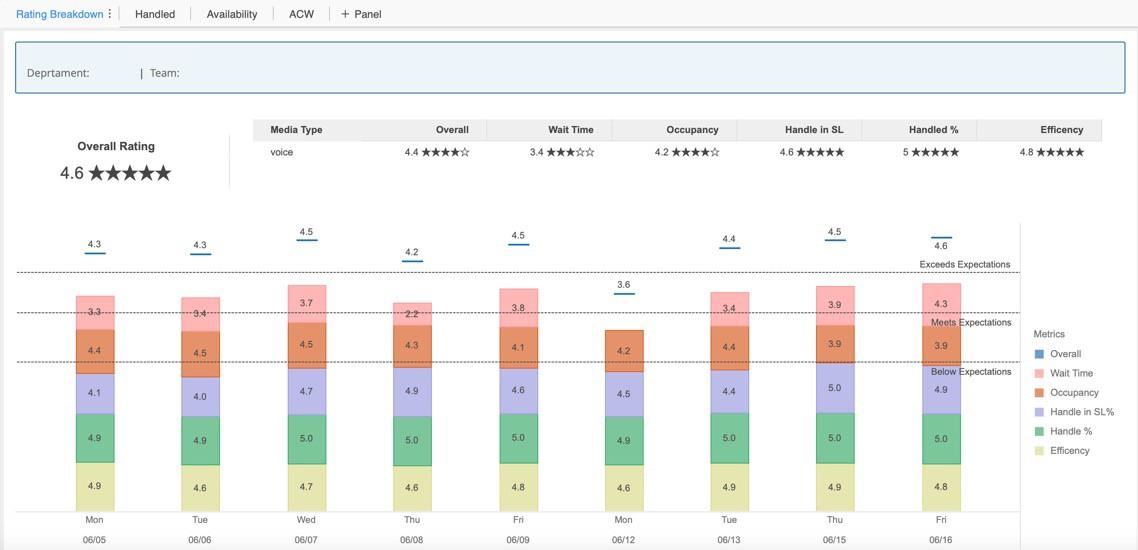
Agent KPIs
Key performance indicators by agent
Track calls, wait time, handle time, NPS survey score, occupancy, and efficiency for each agent by date and 30-minute interval.
Attributes
- Date
- 30-minute interval
- Agent name
Metrics
- Calls
- Average wait time
- Average handle time
- Average NPS survey score
- Occupancy
- Efficiency
Filter by
- Date
- 30-minute interval
- Agent name
Putting these reports to work
Each report answers one question. They’re more useful together, because they read from the same data. One dashboard can trace a drop in sentiment to a topic, a queue, an agent, and that day’s schedule.
Most teams start with the out-of-the-box reports, then adapt them as new questions come up. If you’ve built a report you think belongs here, or you want help taking one further, tell us.